Intelligence - KPI Dashboard
- 28 Dec 2022
- 1 Minute to read
- Print
- DarkLight
Intelligence - KPI Dashboard
- Updated on 28 Dec 2022
- 1 Minute to read
- Print
- DarkLight
Article Summary
Share feedback
Thanks for sharing your feedback!
Summary
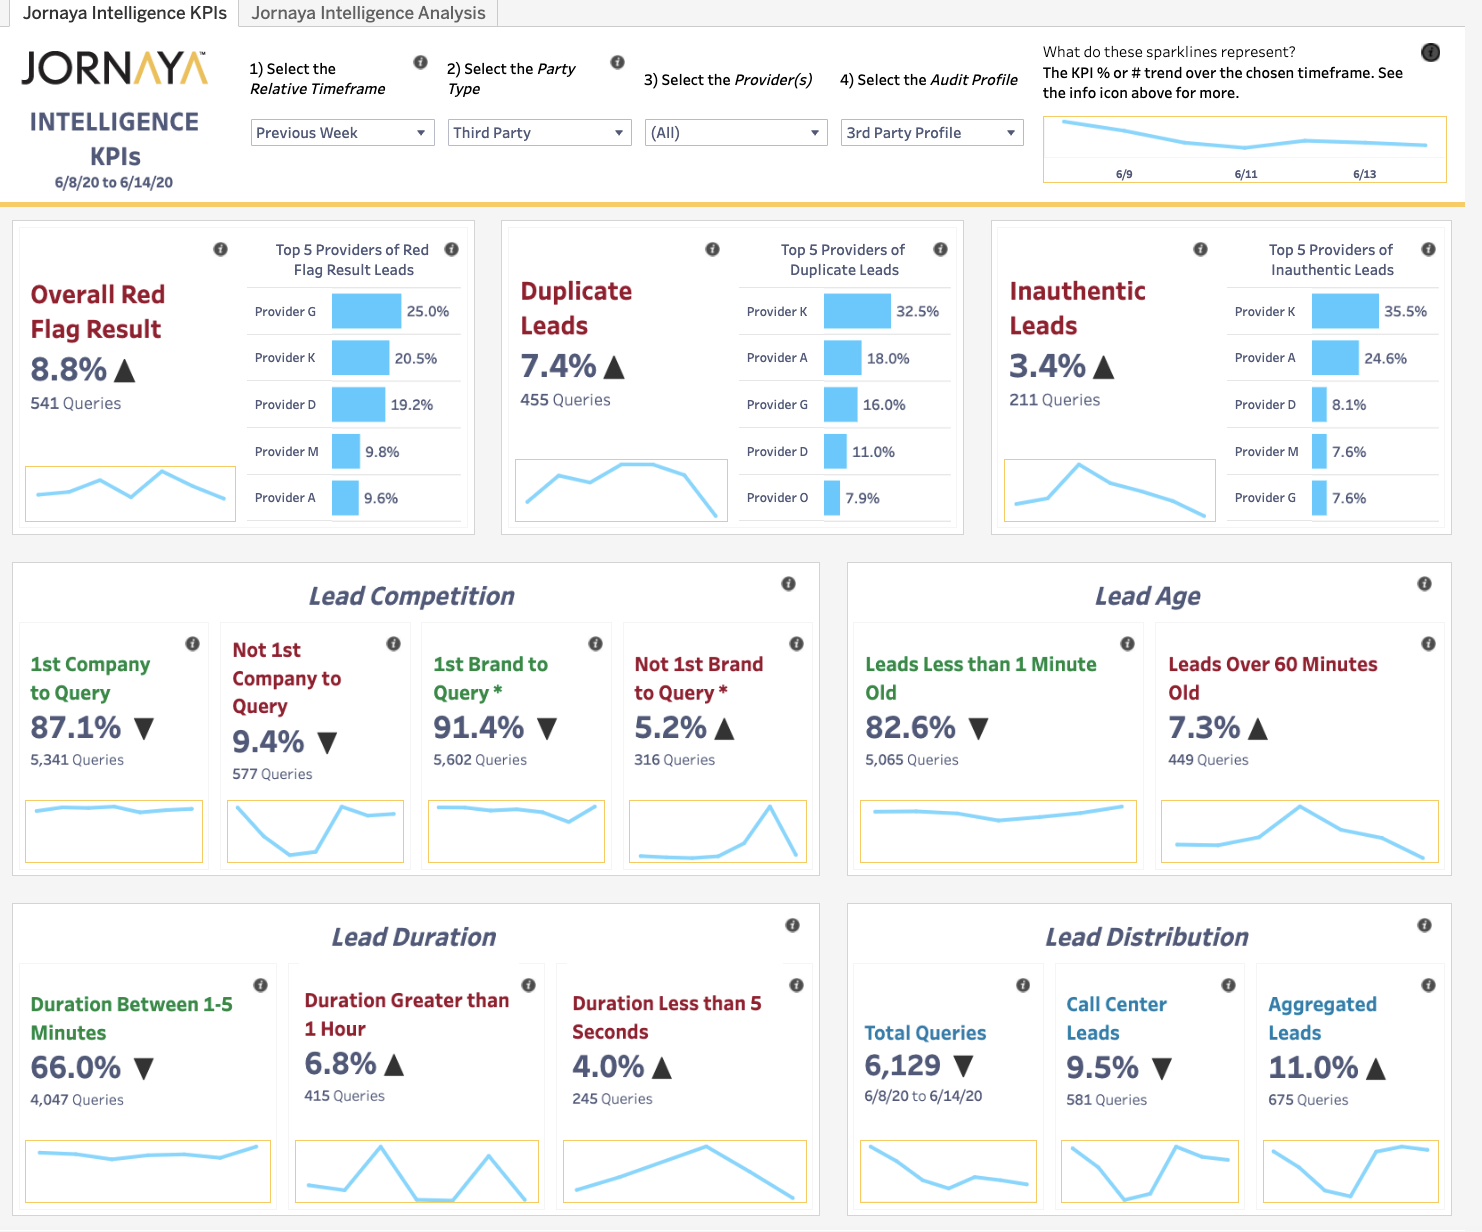
The Intelligence KPI Dashboard provides an at-a-glance overview of the quality of your leads and lead providers. It includes directional Arrows represent an increase or decrease in leads of a particular category compared to a previous timeframe. It features color-coding for easier interpretation of lead quality and facts about lead distribution.
How to Use the KPI Dashboard
Watch the following video to learn how you can analyze a data point like Lead Age with the KPI Dashboard and Intelligence Analysis Dashboard:
Sections of the Dashboard
- Overall Red Flag Result
- Shows the overall and trending percentage of leads flagged as Red based on your account's flag settings in the Jornaya Member Portal
- Duplicate Leads
- Indicates whether or not you have queried the same LeadiD previously.
- Inauthentic Leads
- Indicates whether or not the LeadiD has been issued by Jornaya.
- Lead Competition
- Indicates if other companies or brands have queried LeadiDs before you.
- Lead Age
- Indicates how much time has passed since the user submitted the lead and when you query the LeadiD.
- Lead Duration
- Indicates how much time the user spent on the lead form.
- Lead Distribution
- Indicates total amount of queries, percentage of f call-center based leads and percentage of aggregated leads.
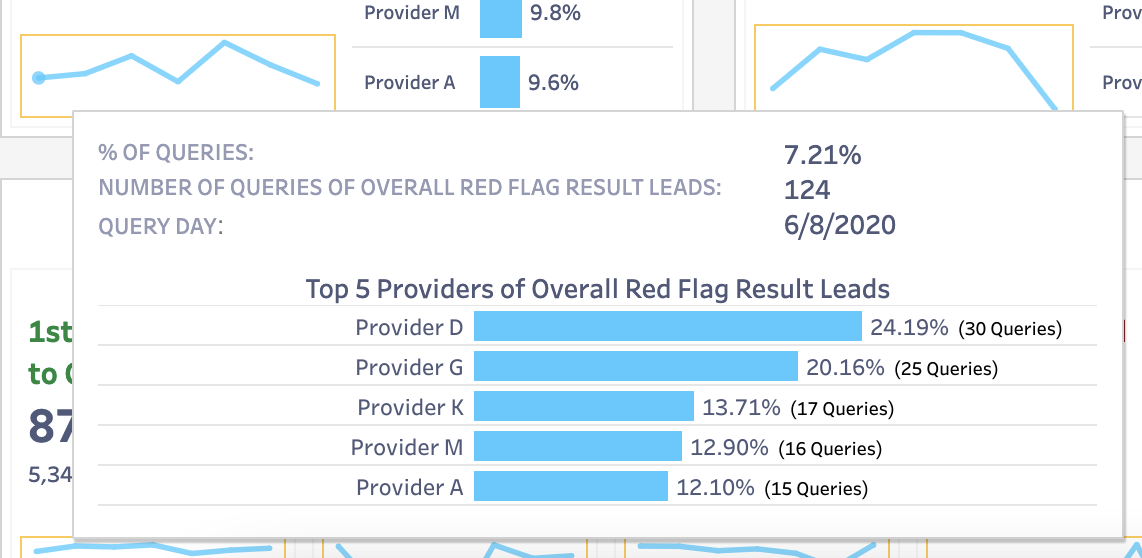
Sparklines
Every KPI on the dashboard features a corresponding sparkline to show how that KPI has trended over the selected time periord. The sparkline dynamically adjusts with the selected relative timeframe and other filters.
You can hover over a specific day, week or month in the sparkline to see overall results for that given timeframe as well as a Top 5 provider breakdown.
What's Next?
To take your lead program to the next level, you can provide outcome data which allows for analysis of how the Jornaya Intelligence data points correlate with your conversion milestones. Be sure to check out the article on how to set up an Outcome Data Feedback Loop and the benefits of having your data paired with Jornaya data!
Was this article helpful?