Outcome Data Dashboard
- 03 Jan 2023
- 2 Minutes to read
- Print
- DarkLight
Outcome Data Dashboard
- Updated on 03 Jan 2023
- 2 Minutes to read
- Print
- DarkLight
Article Summary
Share feedback
Thanks for sharing your feedback!
Summary
The Outcome Data Dashboard provides insights into how the Jornaya Intelligence data points correlate with your Outcome Data.
Jornaya Intelligence Data Points
You can filter the results based on the following Jornaya Intelligence data points:
- Total Worked Leads
- Lead Age
- Lead Duration
- Total Hops
- Consumer Velocity (1 Week lookback)
- IPVelocity (1 Week lookback)
- DeviceVelocity (1 Week lookback)
- LeadVelocity (1 Week lookback)
- Advertiser LeadVelocity (1 Week lookback)
- Lead Type
How to Use the Dashboard
Watch the following video to learn how you can analyze a data point like Lead Age with the Outcome Dashboard:
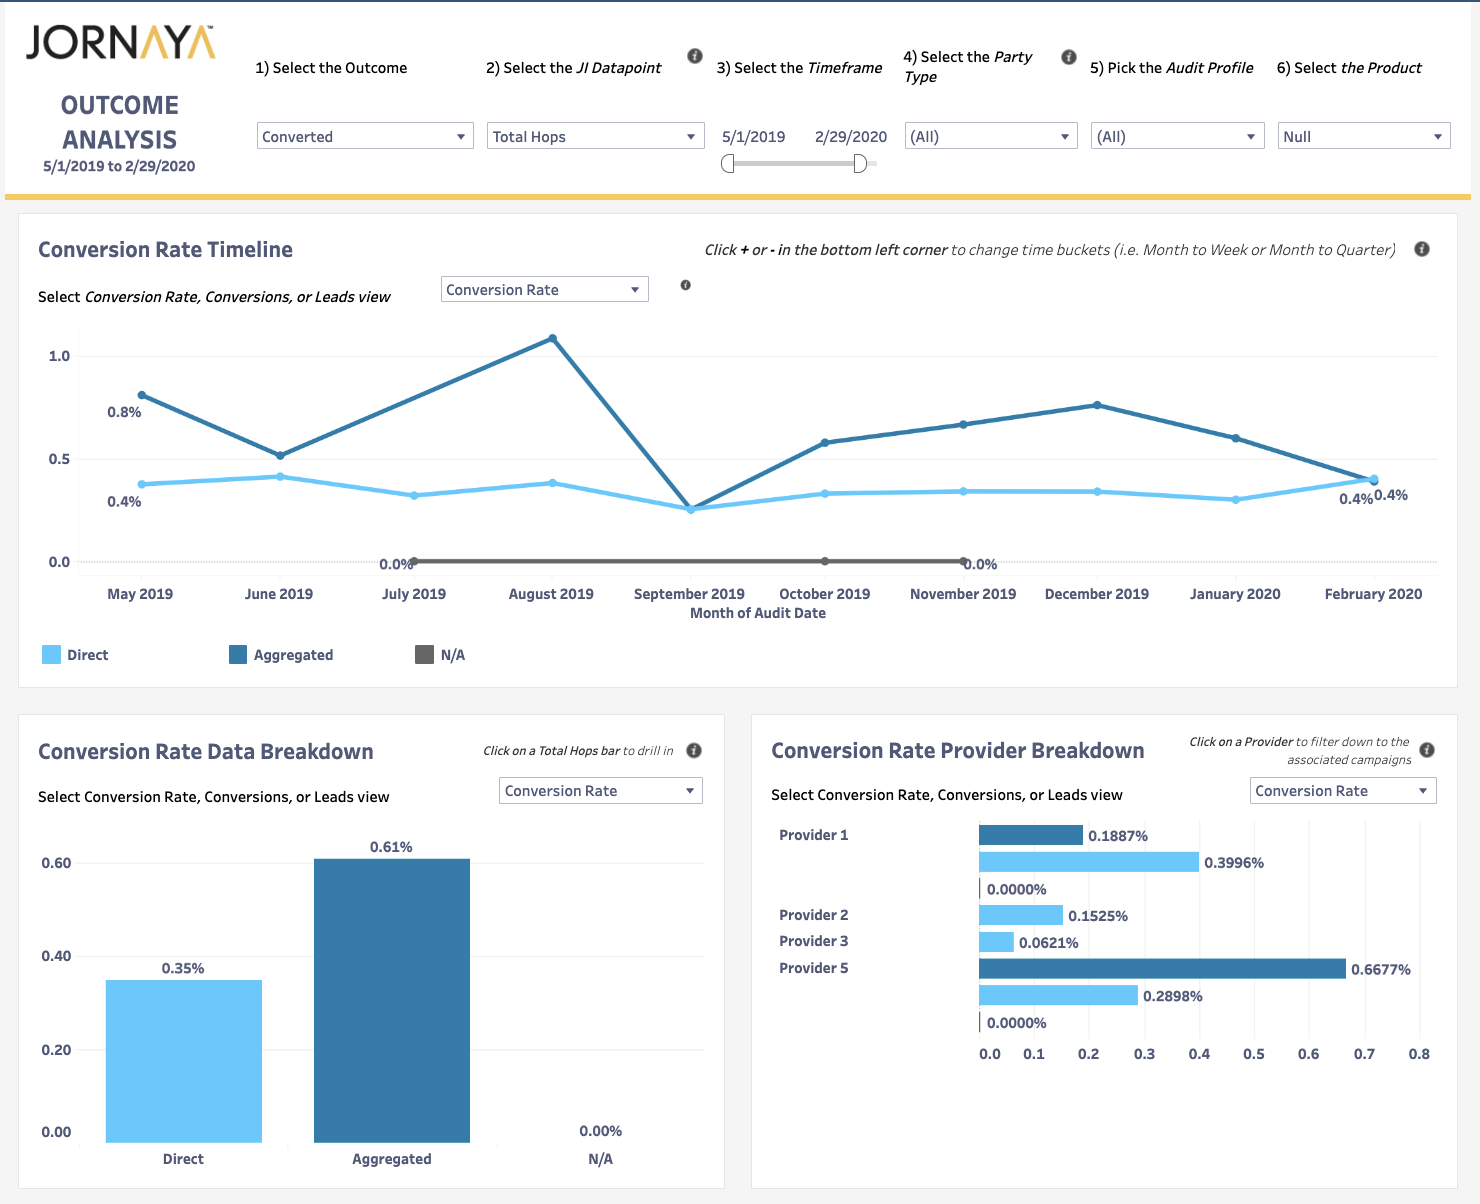
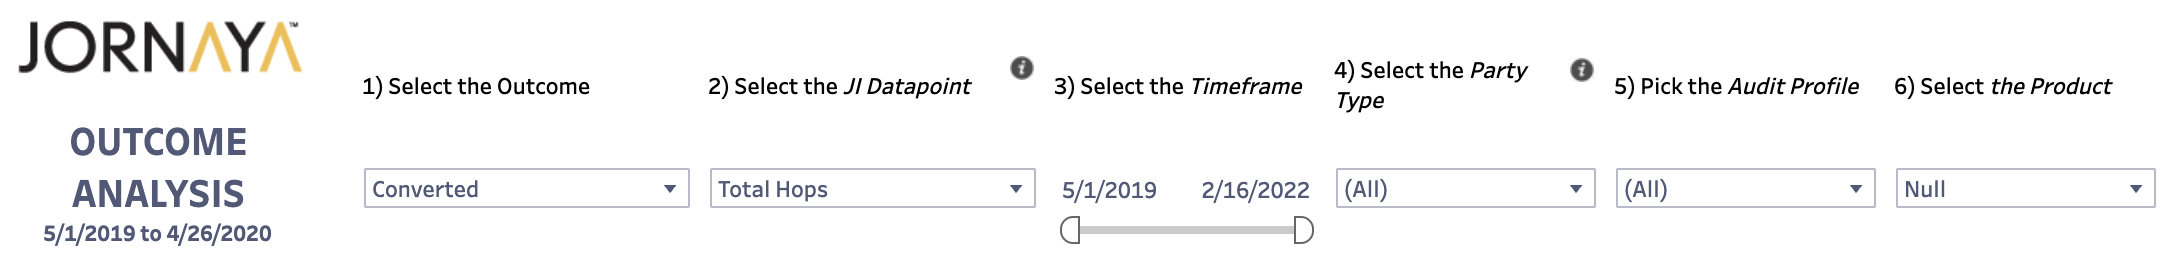
At the top of the dashboard, you can filter down to the specific Jornaya Intelligence data point of interest, timeframe, 1st party or 3rd party, audit profile and product.
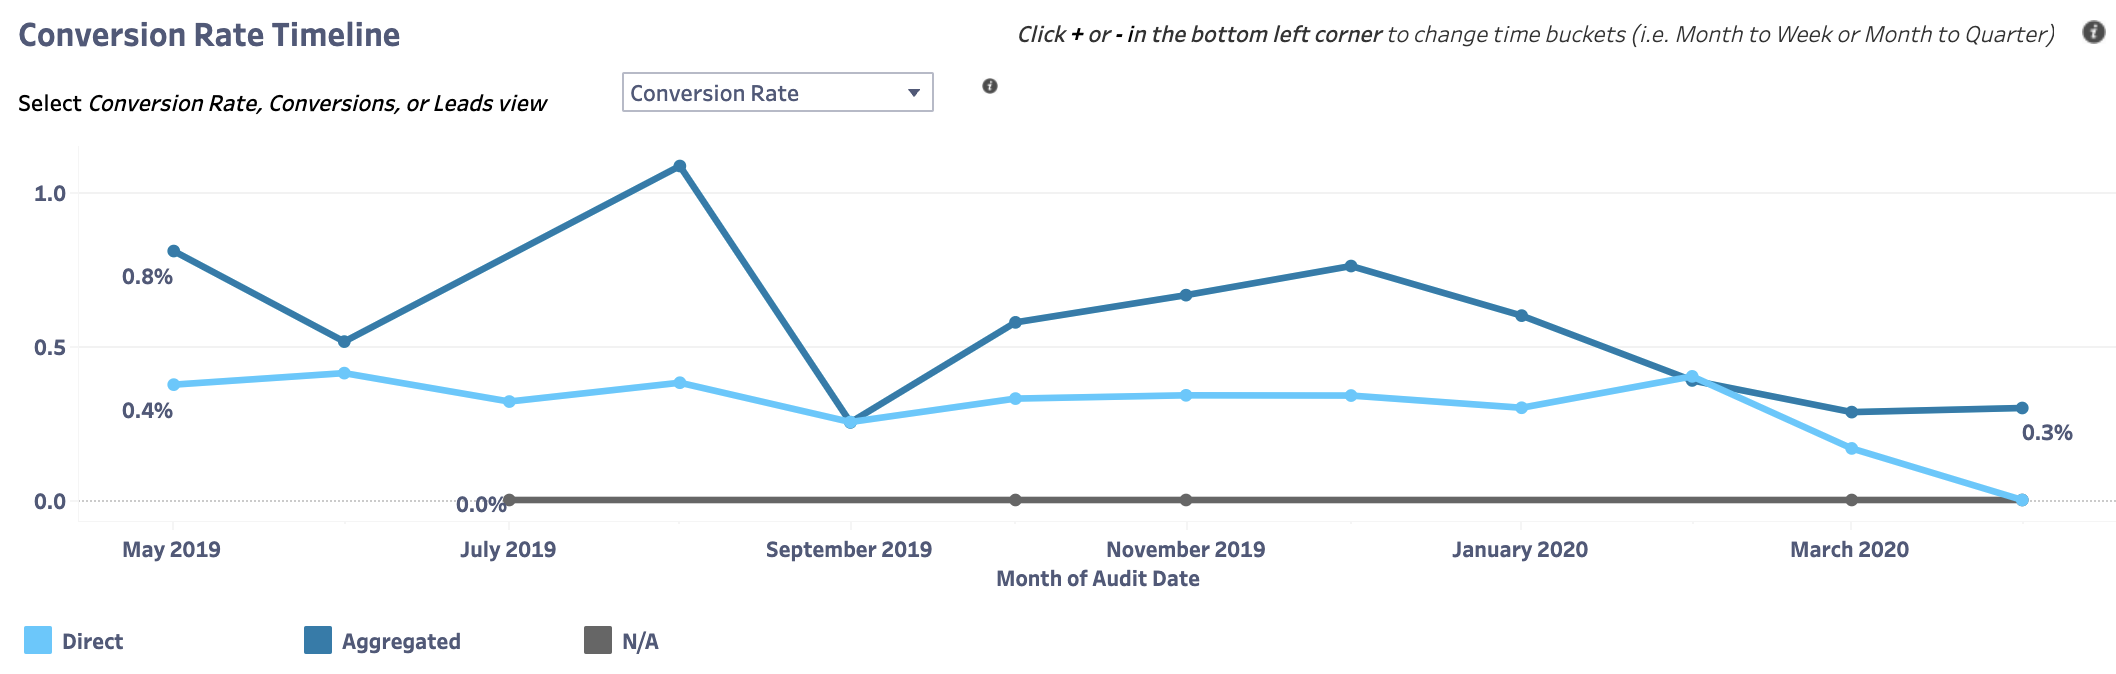
In the Conversion Rate Timeline, you can view the trends over time at a daily, weekly, monthly, quarterly or yearly level. You can hover over a specific date to see a tooltip with further details regarding conversion rate, conversions, % of conversions, worked leads and % of worked leads. Also, you can click and drag to select a specific timeframe to drill down to that timeframe.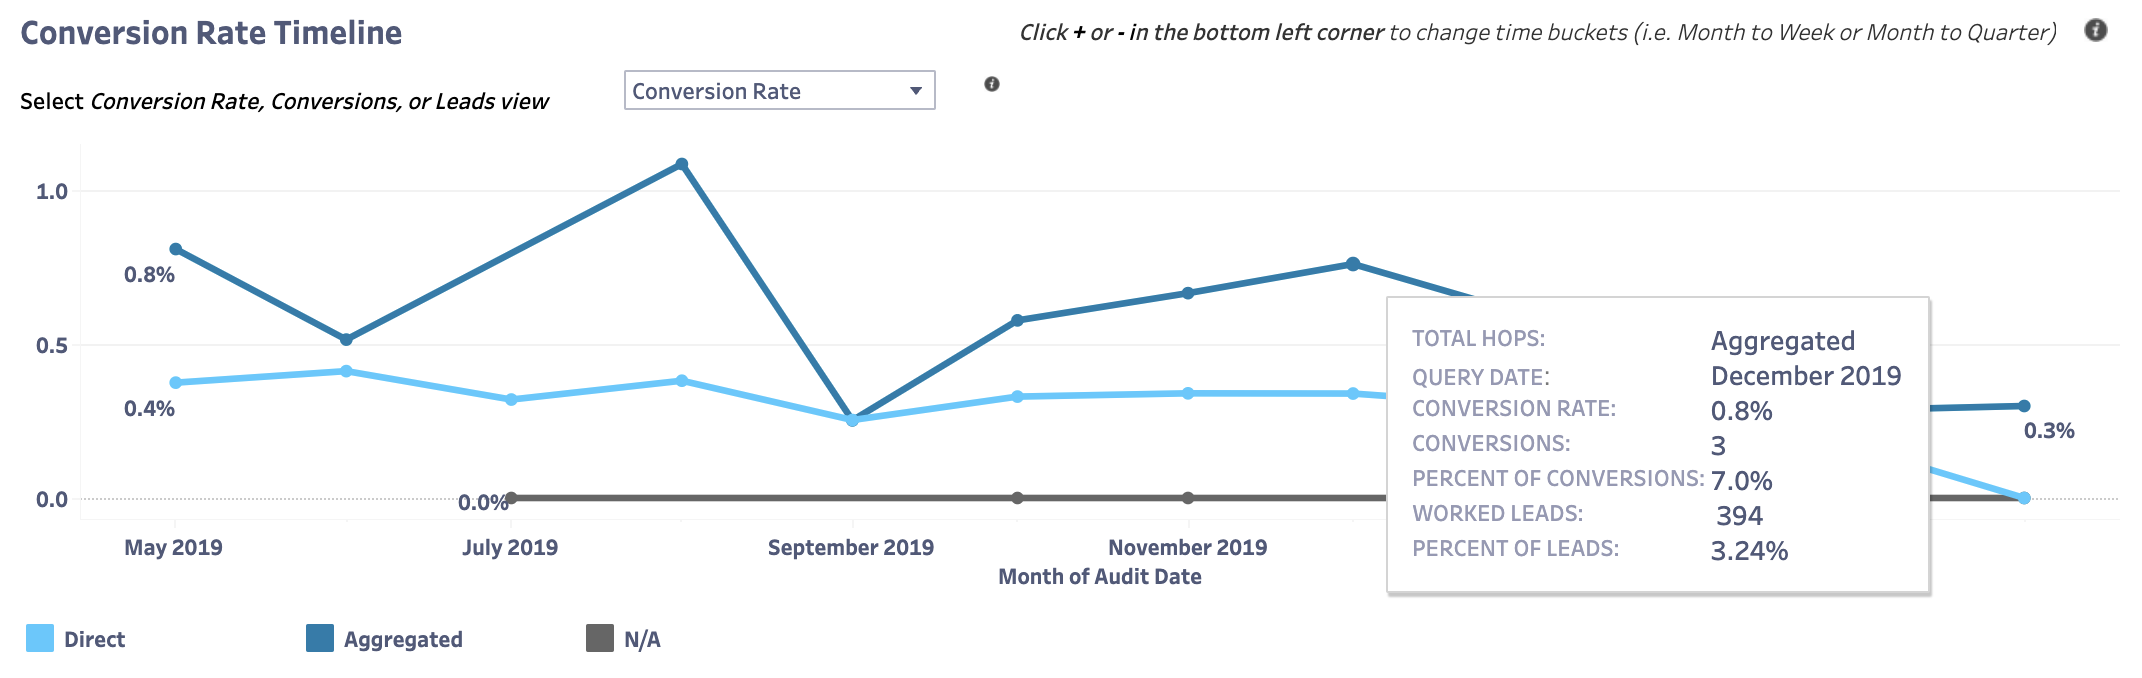
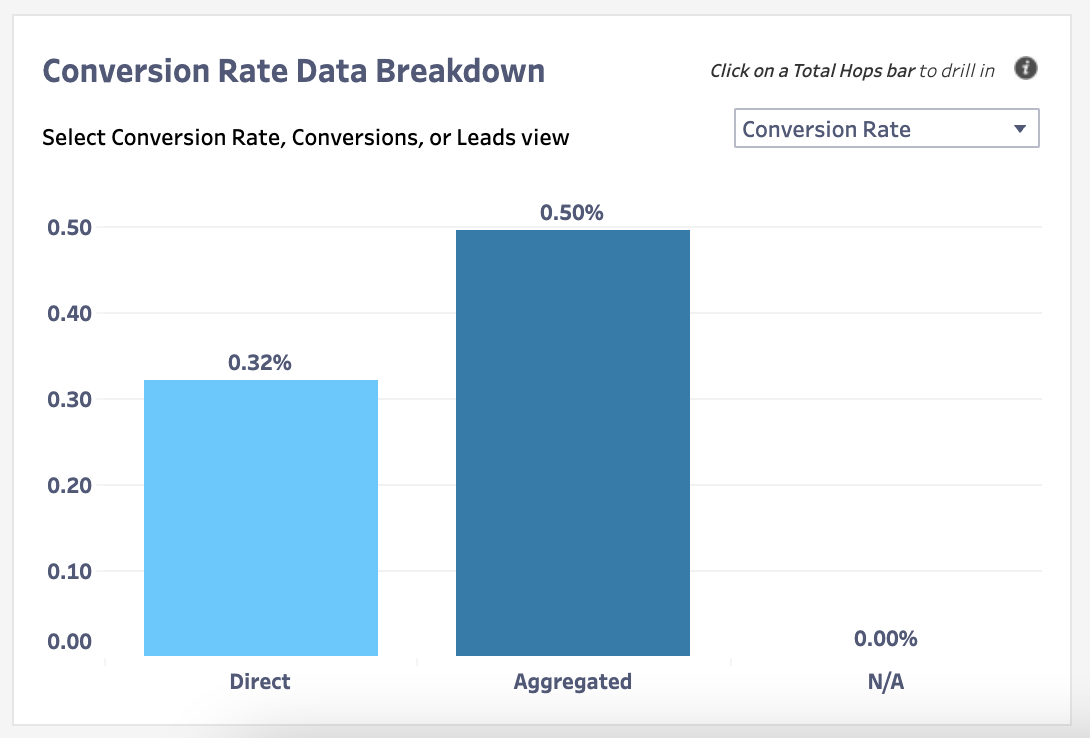
In the Conversion Rate Data Breakdown section, you can see a comparison of the different values for the selected data point for your selected timeframe. You can also hover over a specific data point tosee a tooltip with further details regarding conversion rate, conversions, % of conversions, worked leads and % of worked leads.
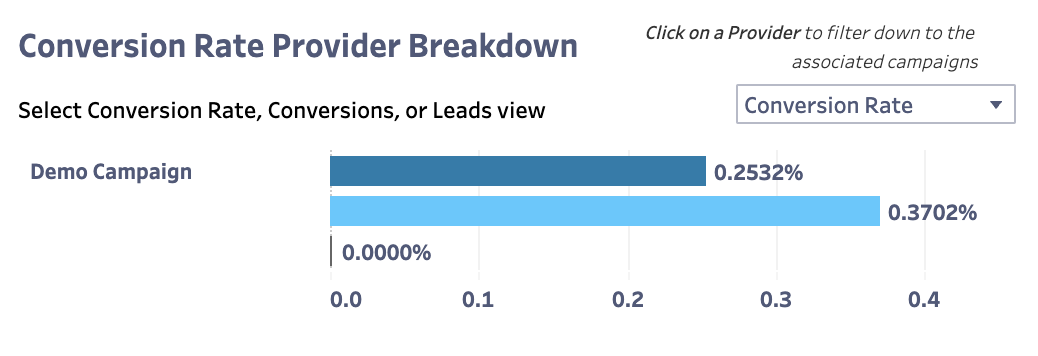
In the Conversion Rate Provider Breakdown, you can see a comparision of all of your lead providers. Also, you can click a specific provider to see a drill down view which includes Campaigns if those were contributed in the outcome data.
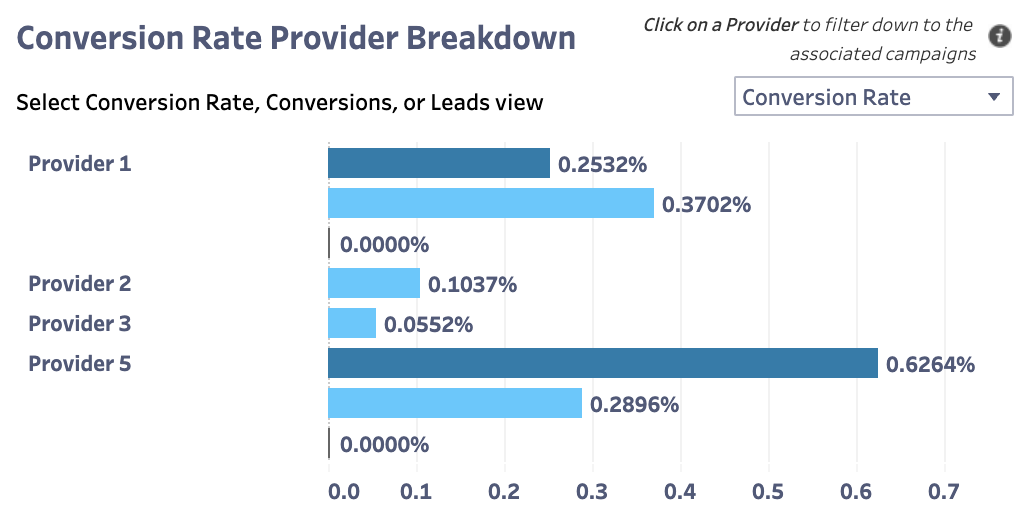
In all 3 main sections (Conversion Rate Timeline, Conversion Rate Breakdown, Provider Breakdown), you can look at trends over time by Conversion Rate, Total Conversions, Percent of Conversions, Total Leads, and Percent of Leads.
Conversion Rates
Shows the conversation rate for a specified outcome within each visual for the different values of the selected JI data point.
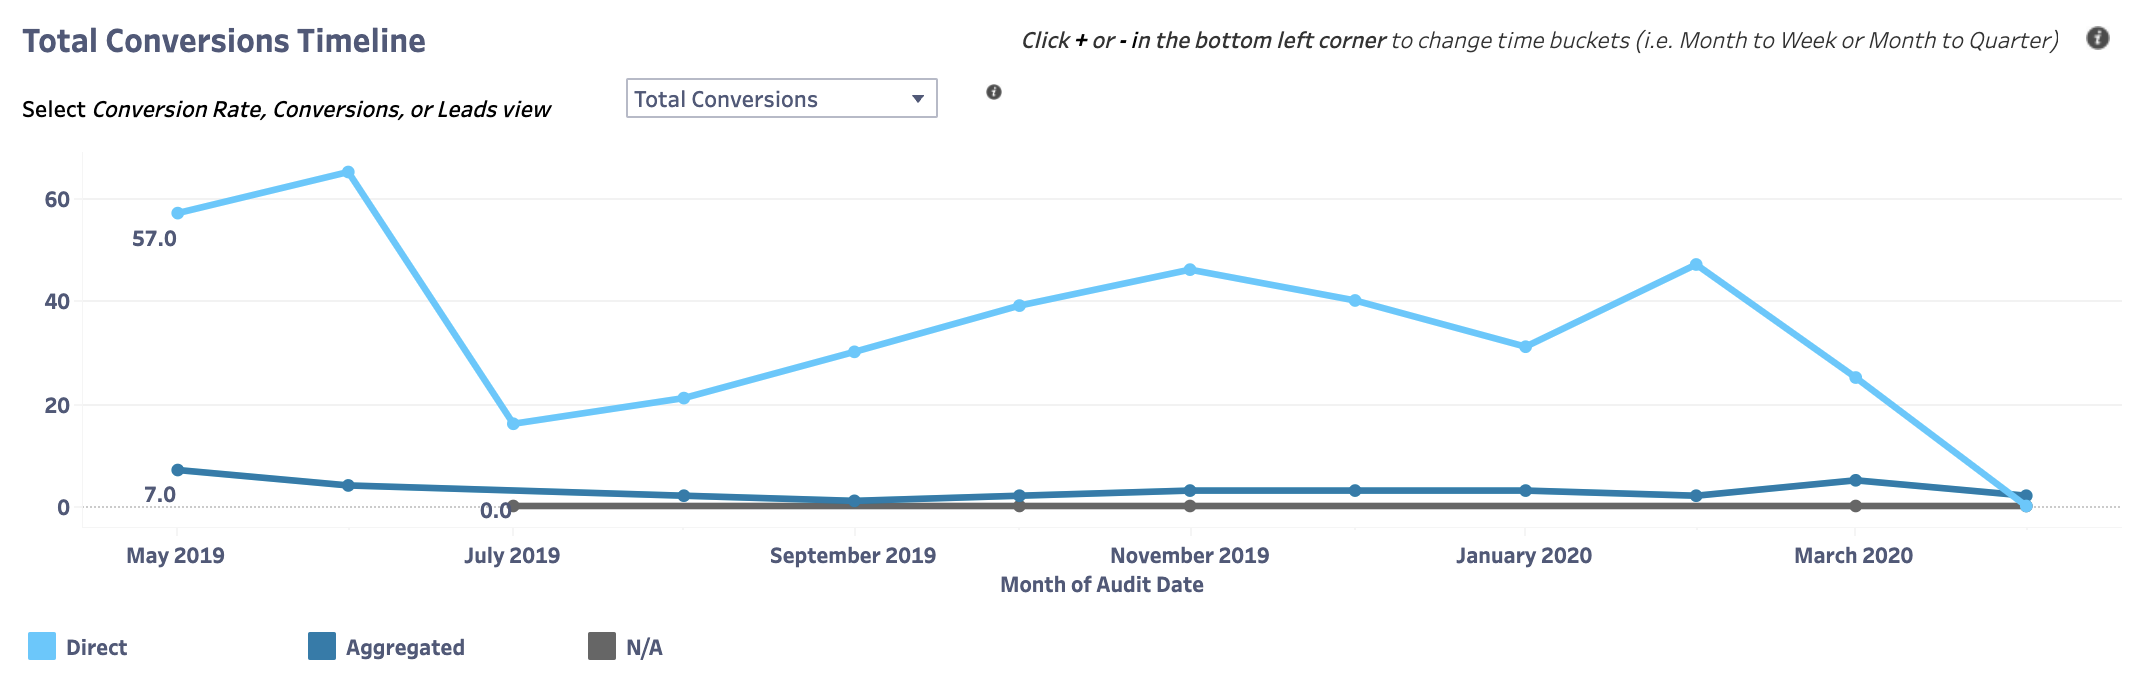
Total Conversions
Shows the total number of converted leads for a specified outcome within each visual for the different values of the selected JI data point.
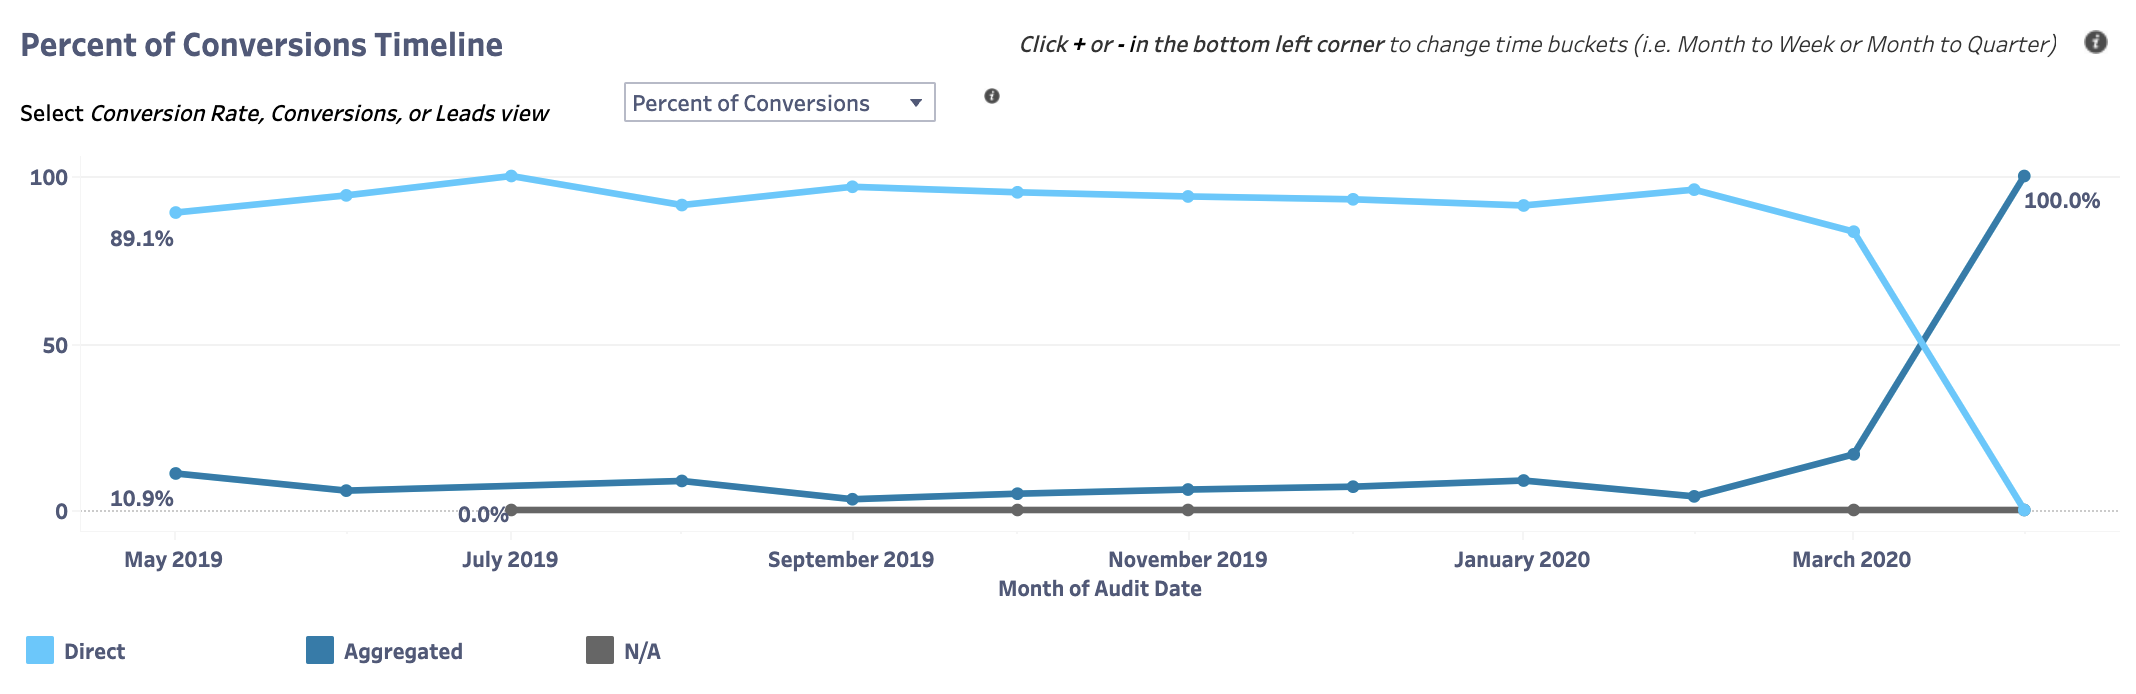
Percent of Conversions
Shows the percentage mix of conversions for a specified outcome for the different values of the selected JI data point.
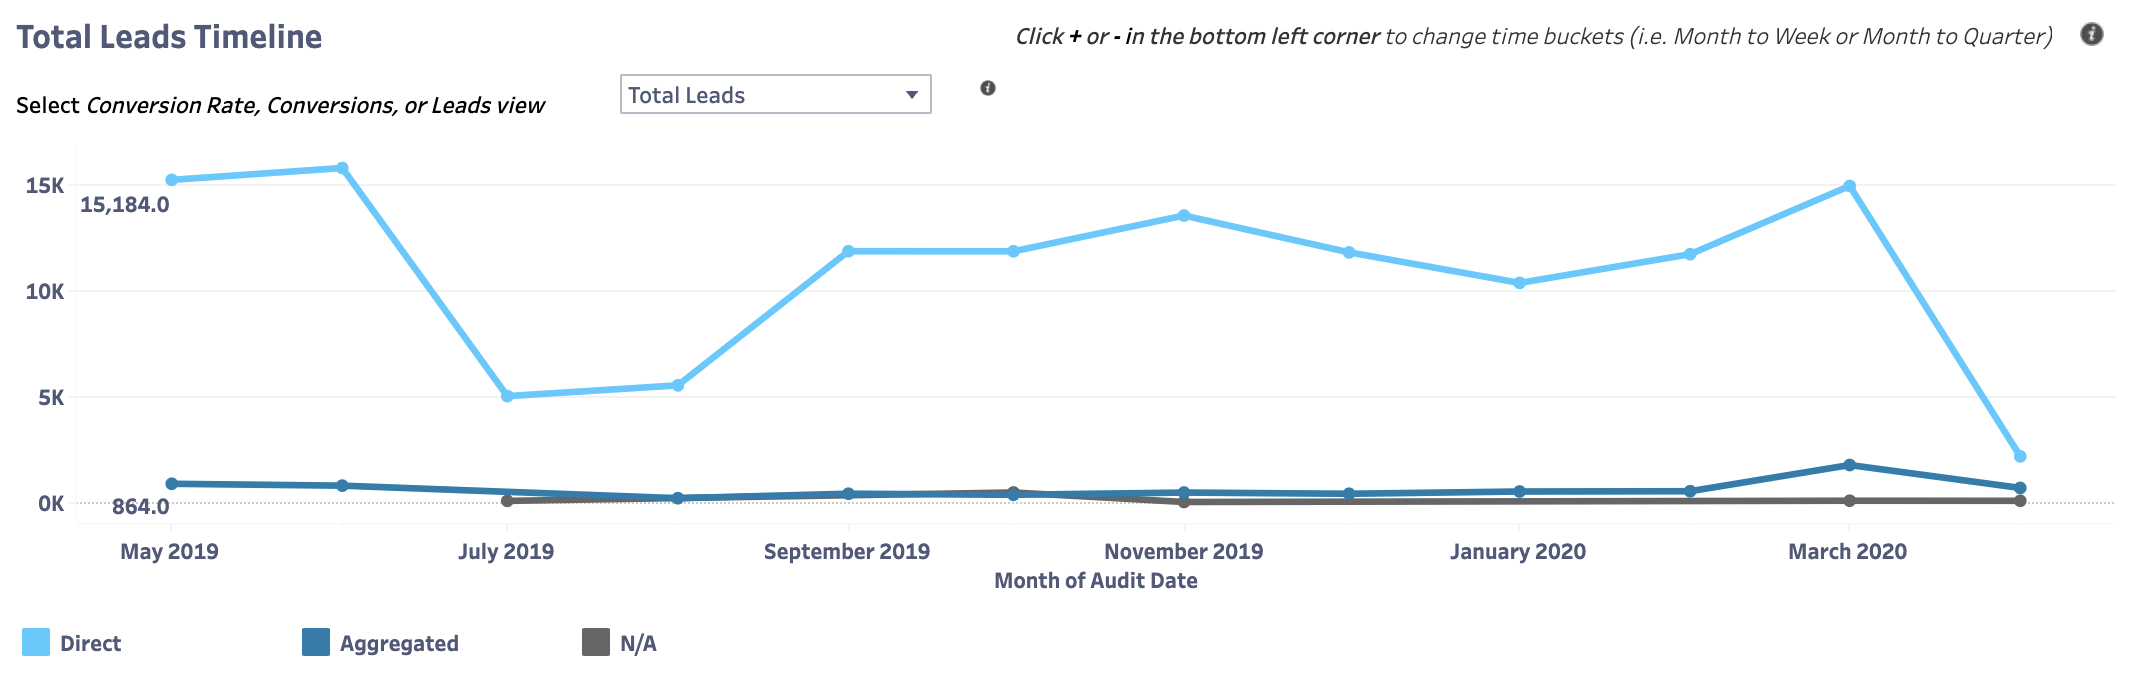
Total Leads
Shows the total number of worked leads within each visual for the different values of the selected JI data point.
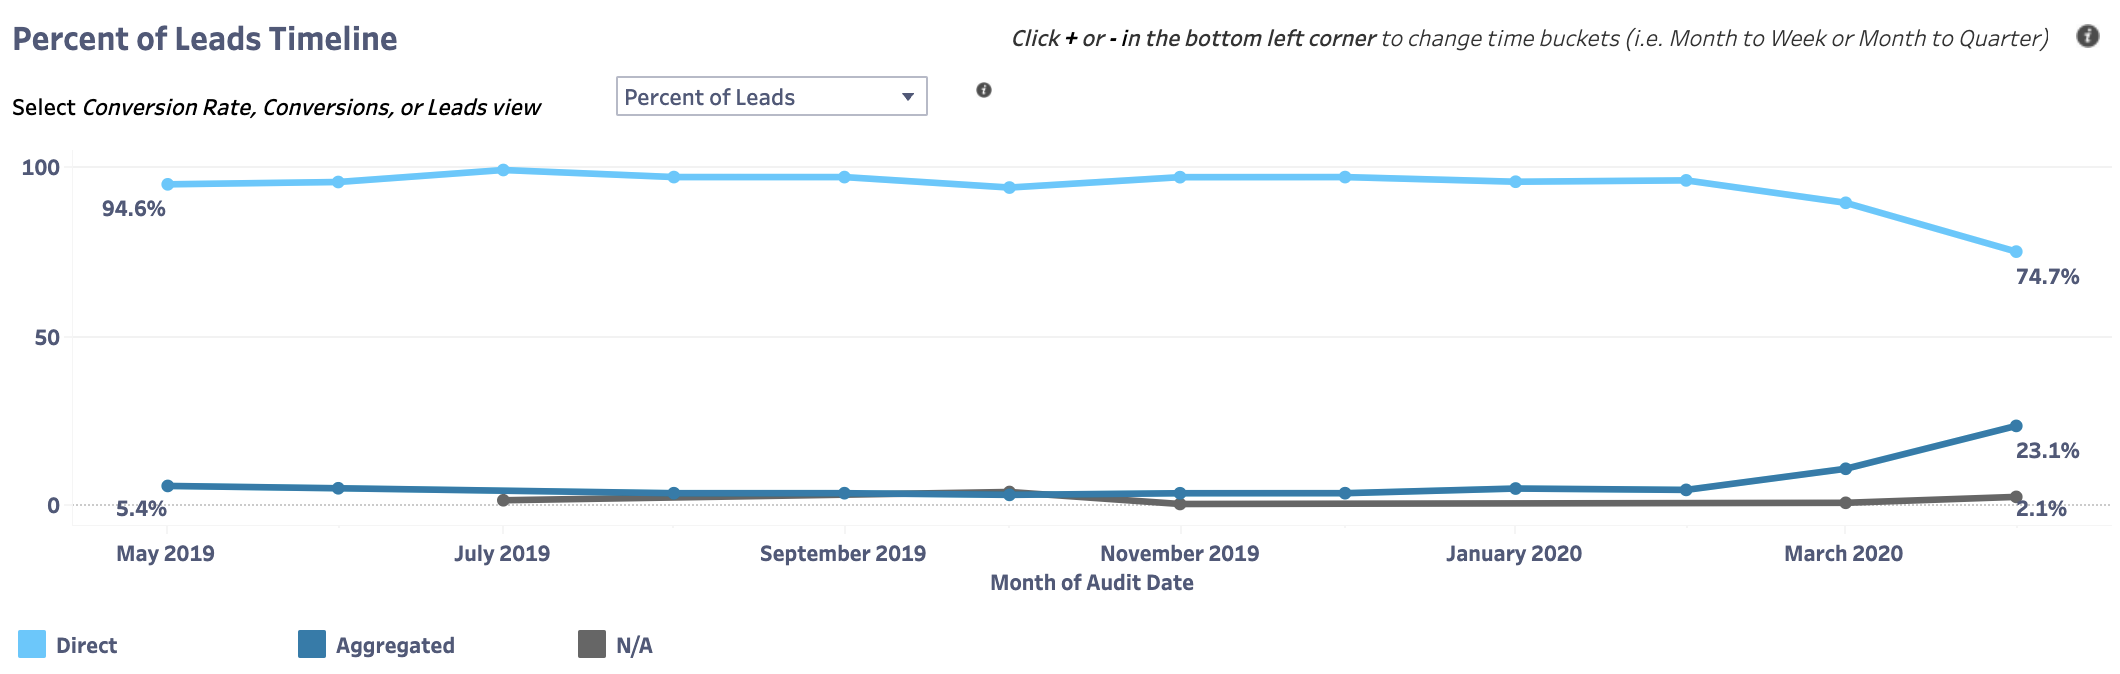
Percent of Leads
Shows the percentage mix of worked leads for the different values of the selected JI data point.
What's Next?
Like what you see? Check out the Outcome Data Specification page for details on how to begin passing outcome data to Jornaya so that the dashboard can be utilized for YOUR leads!
Was this article helpful?