Activate Insights Dashboard
- 02 Jun 2022
- 3 Minutes to read
- Print
- DarkLight
Activate Insights Dashboard
- Updated on 02 Jun 2022
- 3 Minutes to read
- Print
- DarkLight
Article Summary
Share feedback
Thanks for sharing your feedback!
Summary
Jornaya's Activate 3.0 Insights are dashboards that leverage our latest behavioral data points and surface trends in your prospect and customer's shopping behavior over time.
Within each Activate Instance, you have one-click access to custom dashboards showcasing unique trends about the shopping behavior of your prospects and customers across the journeys you are monitoring.
Your Insights dashboards will help you to quickly inform and confidently refine your marketing outreach strategies and better personalize your campaign content and messaging.
Please Note:
Activate insights update daily at 9:00am EST. If you are viewing insights before 9:00am EST and don't see updated data as of yesterday, you will need to close and reopen or your browser or do a hard refresh (shift + command + R on Mac) to see the updated data.
View Options
Short Term: insights based on the most recent run, data from the prior week (7 days), and month to date data.
Long Term: insights based on the past 6 months and past year.
Filters
Activate Instance - the ability to filter the data based on a specific Activate instance configured in the Jornaya user interface

Journeys - the ability to filter the data based on “All Monitored Journeys” (aggregate data across all journeys purchased for monitoring as part of your Activate contract) or a specific purchased journey selected for monitoring as part of the Activate instance (i.e. if you are subscribed to "Mortgage-General" but did not select "Mortgage-General" for monitoring in your Activate instance, there will be no insights for "Mortgage-General")
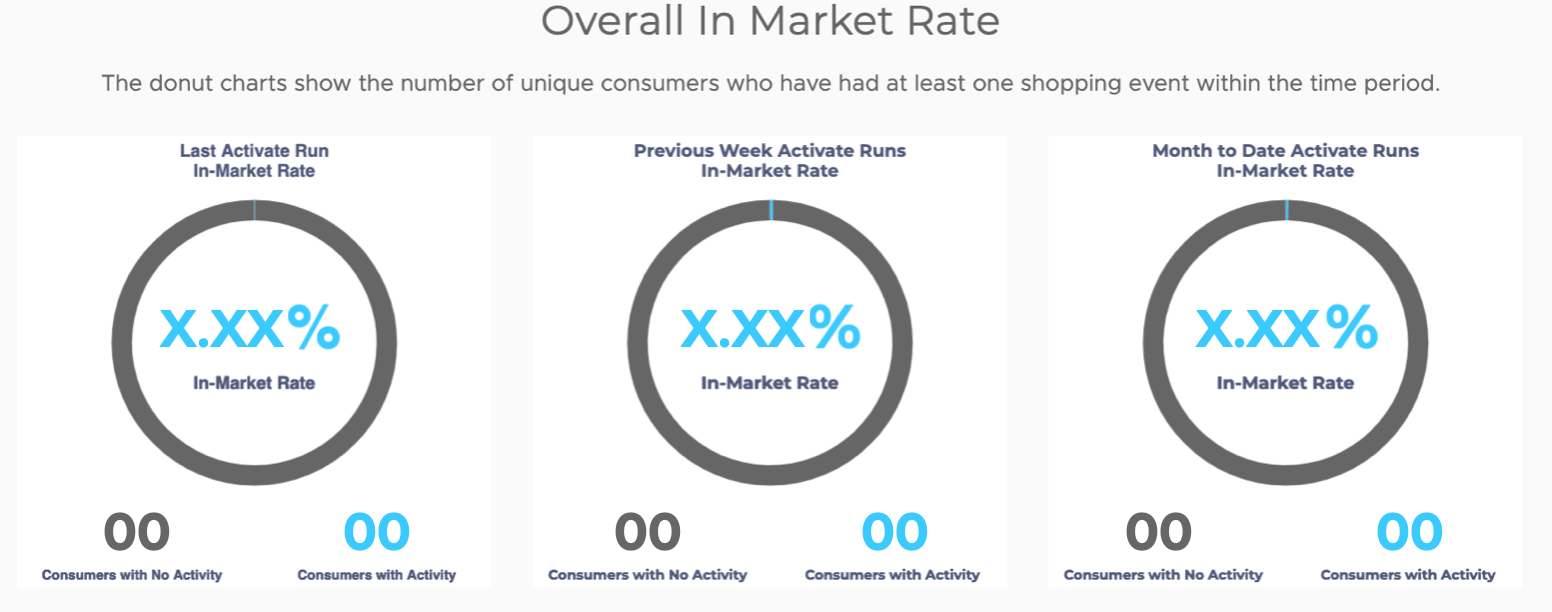
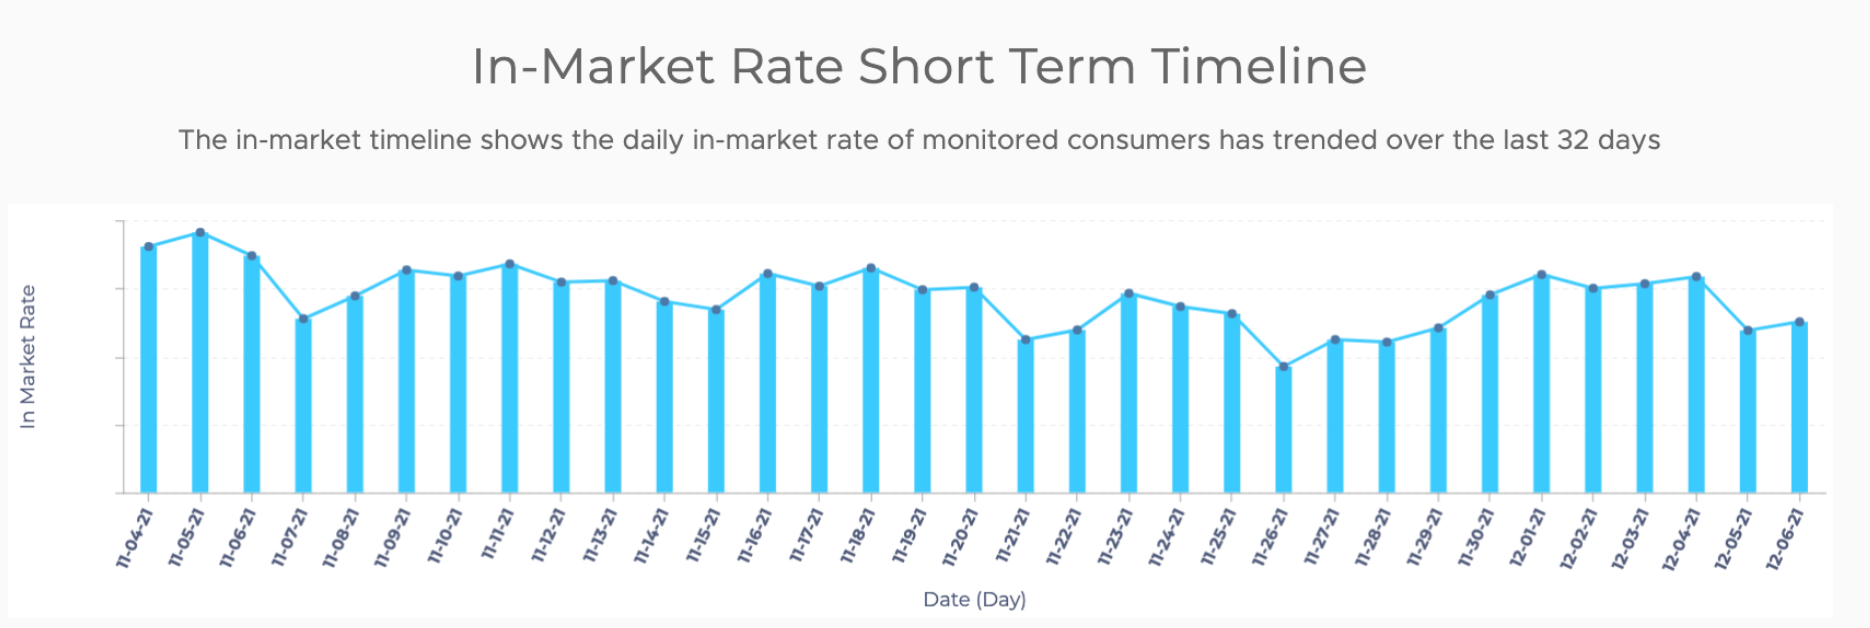
In-Market Rates
**Displays how many unique consumers have exhibited shopping behavior over the given time frame for the selected journey package.
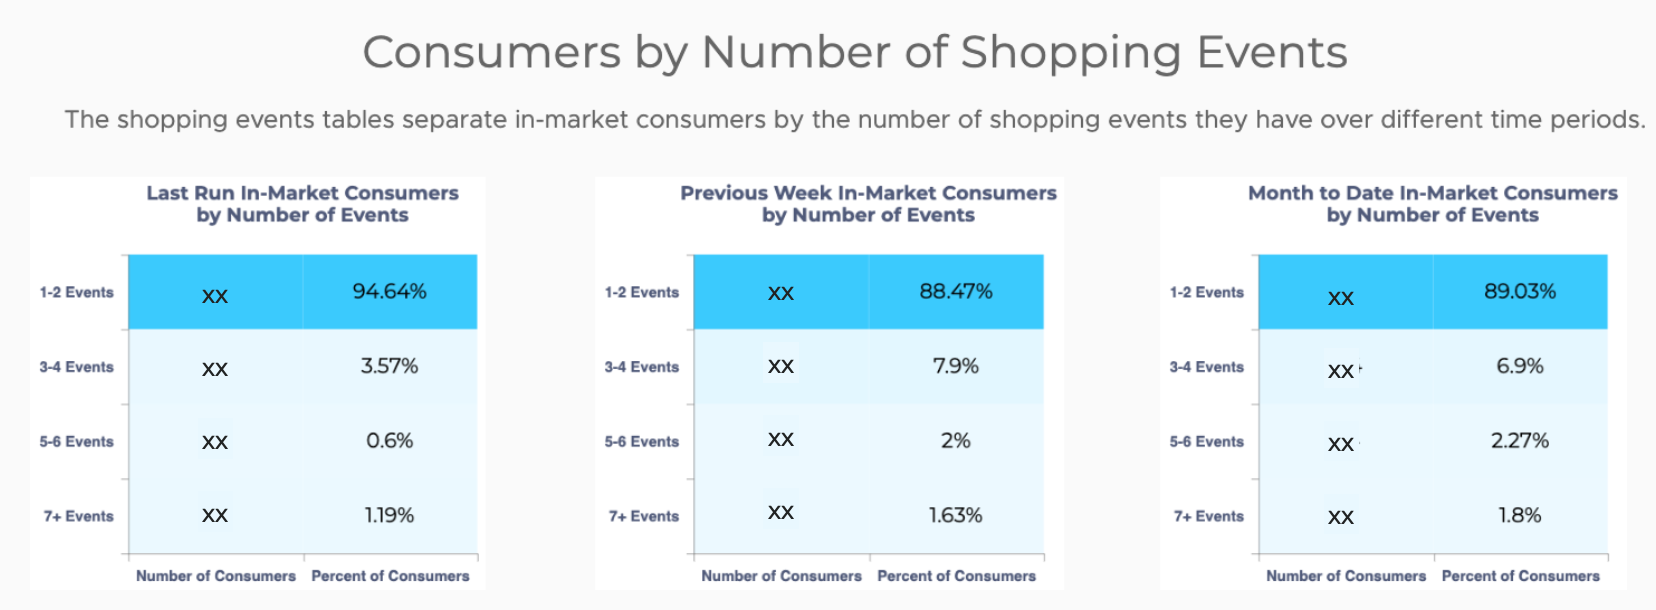
Consumers by Number of Shopping Events
**Displays how often consumers are shopping for specific products over varying timeframes.
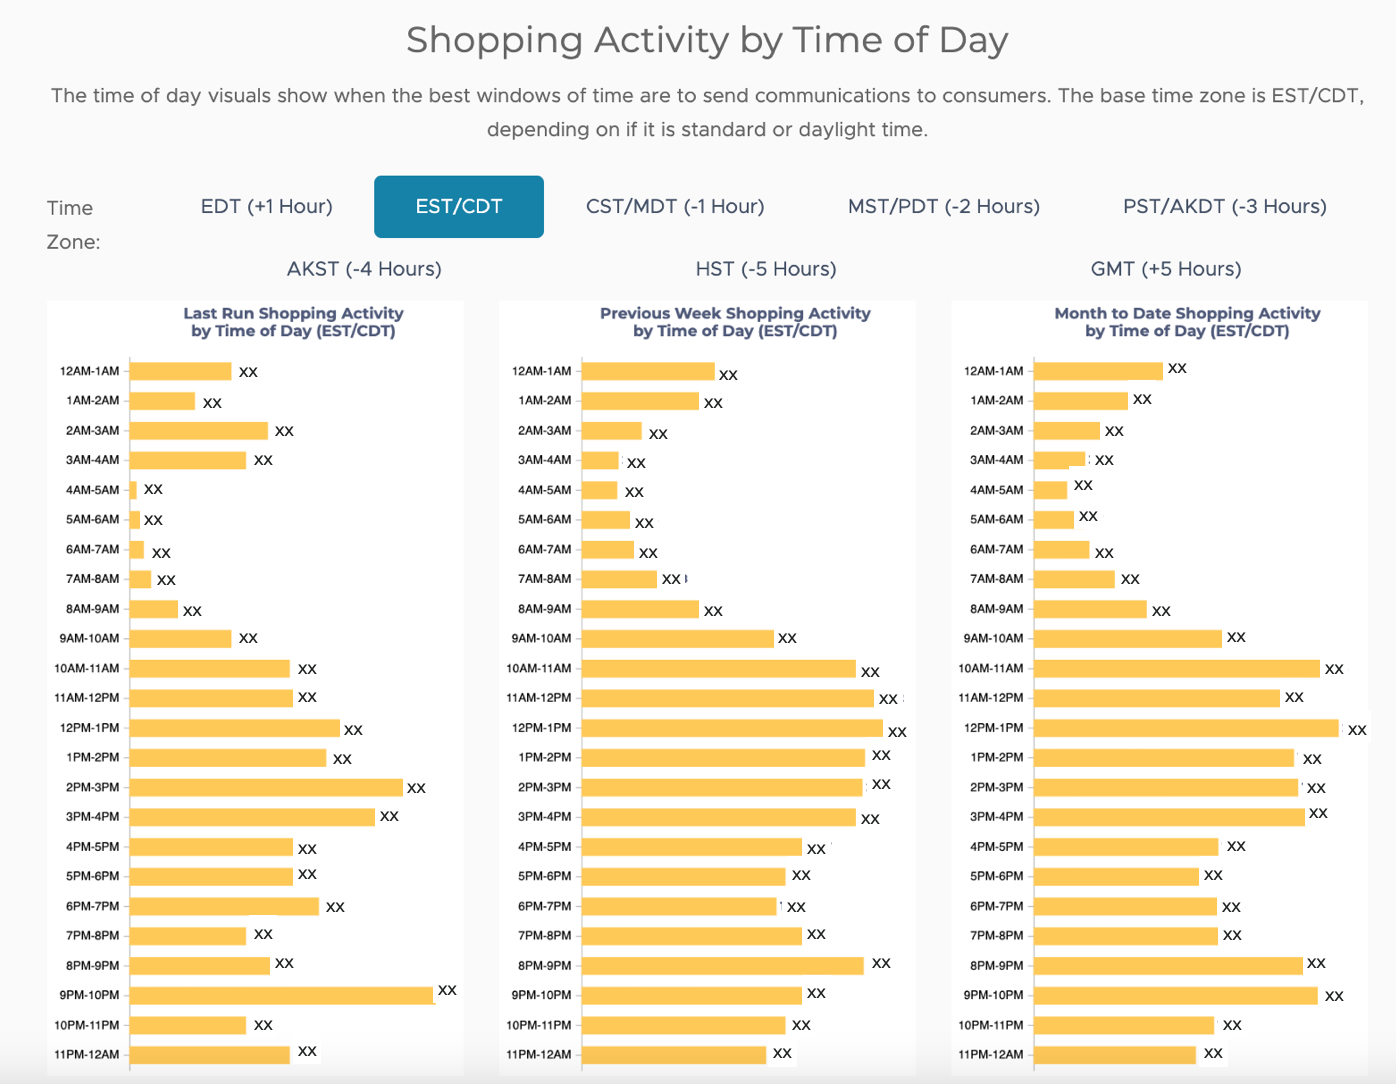
Consumers by Time of Day
**Displays consumer shopping activity broken down by the hours that Jornaya sees them during the day.
FAQ
What insights will be available as soon as I start using Activate?
When you get your first day's worth of Activate data, the insights for that instance will only include data from the prior day. The “Last Run” and “Month to Date” visuals will be the exact same data. The Long Term view will be empty. As the data accumulates over time, the previous week, month to date and long term views will visualize data.
In the case of multiple Activate Instances where each Instance is monitoring different customer lists and different journeys - what is displayed when I select ‘All Monitored Journeys’?
When you select ‘All Monitored Journeys’ you will see insights across all journeys configured for that instance. For example, if you’ve purchased 'Mortgage - Purchase' and 'Mortgage - Refinance', but only configured 'Mortgage - Purchase' for your Activate instance, you will only see insights for 'Mortgage - Purchase'.
How do the Previous Week visuals work?
The Previous Week visuals show data based on the prior week period of Sunday through Saturday. You will not see data in these visuals until you’ve been running Activate through your first Sunday through Saturday period. For example, if you start running Activate on a Friday, the “Previous Week” visual will be blank until Sunday. On Sunday, the previous week filter will only show data for Friday & Saturday as those were the only 2 days worth of data in the previous week period.
How do the Long Term visuals work?
The Long Term visuals require Activate to be running for at least a month and it does not look back historically prior to your use of Activate. As the data continues to accumulate, the long term visuals will build out the previous 6 month and previous 12-month views.
Was this article helpful?